The Queries and Reports section is the heart and soul of the Traffic Collision Database. It represents the most substantial features of the product and fully display the Database's power.
Using the general query option, users can query along one or more parameters, everything from street name, direction, primary collision factor, and city name to date, time, reporting district, and number injured. Querying can also include party, victim, and condition information.
The reports are where the analysis truly comes into play. Available reports include intersection historical, intersection high incidence, midblock historical, midblock high incidence, reports by officer, collision reports, queries by the month, citations reports, and many more.
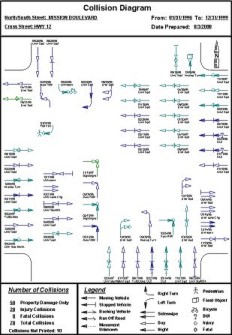
Report data can be sorted by primary collision factor, time of collision, distance and direction, and other parameters, while the Collision Diagram's colors can be customized to suit the user's needs (sample Collision Diagram at top left).
The Collision Diagram focuses on a specific intersection and displays all collisions within a specified distance, the time they occurred, the degree of injury, the direction of travel, and collision types.
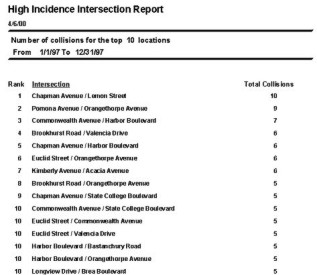
While the Collision Diagram offers analysis of a particular intersection, the Intersection High Incidence Report (second image at left) ranks the intersections with the highest number of collisions over a specified period of time. The user can specify how many locations are included in the report.
Other reports include Collision Severity Summary, Collision Type Summary, Midblock Historical, Midblock High Incidence, Reports by Officer, Citations by Officer, Officer Activity Report, DUIs, and Collisions by Day and Week.